TX Labs: A Space for Accelerated AI Innovation
3 min read
It’s been 8 months since we blogged about Horizontal Pod Autoscaling in Transifex, and around 4 months since we added Spot Instances Worker Groups to our Kubernetes cluster. A lot of exciting things have happened in our DevOps team during this last quarter, one of them being the addition of Vertical Pod Autoscaling, which we present in this post.
With this latest iteration on our Kubernetes autoscaling strategies, we have gained a lot more flexibility and ease-of-mind for when large workloads appear. Of course, the complexity has gone up a little, and we will talk about that in the next chapter. Βut the ability to add more resources to a running pod, on the fly, and thus avoiding Out Of Memory errors and CPU throttling issues is, frankly, priceless.
Let’s start by taking a look at how VPA works.
The Vertical Pod Autoscaler consists of 3 components:
We should demystify and better understand what each component does, before moving on.
> For CPU the objective is to keep the fraction of time when the container usage exceeds a high percentage (e.g. 95%) of request below a certain threshold (e.g. 1% of time). In this model, the “CPU usage” is defined as mean usage measured over a short interval. The shorter the measurement interval, the better the quality of recommendations for spiky, latency sensitive workloads. Minimum reasonable resolution is 1/min, recommended is 1/sec.
> For memory the objective is to keep the probability of the container usage exceeding the request in a specific time window below a certain threshold (e.g. below 1% in 24h). The window must be long (≥ 24h) to ensure that evictions caused by OOM do not visibly affect (a) availability of serving applications (b) progress of batch computations (a more advanced model could allow user to specify SLO to control this).
A few more details of VPA:
First things first, we enable the “verticalpodautoscalers” resource for kube-state-metrics, as it is not included by default. Also, it is advisable to use Prometheus as the metrics storage that VPA utilizes, and since we already have Prometheus deployed in our cluster (via this official helm chart), we make use of that too.
Enabling of kube-state-metrics resource:
...
kube-state-metrics:
  collectors:
    verticalpodautoscalers: true
...
Deploying VPA:
admissionController:
  enabled: true
recommender:
  extraArgs:
    pod-recommendation-min-cpu-millicores: 10
    pod-recommendation-min-memory-mb: 160
    v: 4
    storage: prometheus
    prometheus-address: http://prometheus-server.monitoring.svc.cluster.local:9090
There is no official VPA helm chart, but that does not stop us! Note that we pass the minimum allowed recommended resource values, define log verbosity, and, as mentioned, utilize Prometheus as the metrics storage for the Recommender.
After the kube-state-metrics configuration step and having installed all VPA components, we are ready to see it in action and to test it out!
Being fans of Helm, we define a new, simple template that can be included in our application repositories and developers can use in order to define VPA objects.
Here it is, with accompanying inline comments:
{{- $global := . -}}
{{- range .Values.vpa -}}
{{- $name := printf "%s-%s-worker" (include "txc.fullname" $global) .name -}}

apiVersion: v1
items:
- apiVersion: "autoscaling.k8s.io/v1"
  kind: VerticalPodAutoscaler
  metadata:
    name: {{ $name }}
    labels:
{{ include "txc.commonLabels" $global | indent 6 }}
  spec:
    targetRef:
      apiVersion: "apps/v1"
      kind: Deployment # We only use Deployments in our context
      name: {{ $name }}
    updatePolicy:
      updateMode: {{ .updateMode | quote }} # VPA update mode
    resourcePolicy:
      containerPolicies:
        - containerName: '*' # All containers
          minAllowed:
            cpu: {{ default "10m" .minAllowedCpu }} # Set 10m as minAllowed CPU if not defined
            memory: {{ default "160Mi" .minAllowedMem }} # Set 160Mi as minAllowed memory if not defined
          maxAllowed:
            cpu: {{ default "500m" .maxAllowedCpu }} # Set 500m as maxAllowed CPU if not defined
            memory: {{ default "2000Mi" .maxAllowedMem }} # Set 2000Mi as maxAllowed memory if not defined
          controlledResources: ["cpu", "memory"] # Track both CPU and memory
kind: List
---
{{ end -}}
Thus, in our application’s Helm values.yaml file we can pass values such as these:
vpa:
  - name: transifex-devops-test
    updateMode: "Auto"
    minAllowedCpu: 100m
    minAllowedMem: 160Mi
    maxAllowedCpu: 500m
    maxAllowedMem: 850Mi
…which should not need any further clarification if you have been reading this far.
So, a new VPA object similar to this will be created:
Name:         transifex-devops-test-worker
Namespace:    devops
Labels:
...
Annotations:
...
API Version:  autoscaling.k8s.io/v1
Kind:         VerticalPodAutoscaler
Spec:
  Resource Policy:
    Container Policies:
      Container Name:  *
      Controlled Resources:
        cpu
        memory
      Max Allowed:
        Cpu:     500m
        Memory:  850Mi
      Min Allowed:
        Cpu:     100m
        Memory:  160Mi
  Target Ref:
    API Version:  apps/v1
    Kind:         Deployment
    Name:         transifex-devops-test-worker
  Update Policy:
    Update Mode:  Auto
Status:
  Conditions:
    Last Transition Time:  2021-06-11T12:00:11Z
    Status:                True
    Type:                  RecommendationProvided
  Recommendation:
    Container Recommendations:
      Container Name:  transifex-devops-test-worker
      Lower Bound:
        Cpu:     100m
        Memory:  297066853
      Target:
        Cpu:     109m
        Memory:  410771395
      Uncapped Target:
        Cpu:     109m
        Memory:  410771395
      Upper Bound:
        Cpu:     146m
        Memory:  554518583
Events:          <none>
One annoying detail is that the memory unit is Bytes, so you would have to divide it by (1024^2) if you want the value in the familiar “Mi” format (example: take target value 410771395 bytes = 410771395/(1024^2) MiB =~ 392 Mi. The issue on that is explained here.
It should also be noted here, that although the VPA target concerns the resource request of the container, the limit is also changed (logically). The new limit is set proportionally to the initial proportion of limit/request. For example, if in a Deployment, the container has memory resources: `request: 100Mi` and `limit: 200Mi` and the recommendation is 175Mi, then the memory resources will be `request: 175Mi` and `limit: 350Mi`, because 200/100=2 and 2*175=350.
Although in the above example we use the “Auto” Update Mode, we did a few tests before actually pushing this into our production EKS cluster.
Firstly, we played around with VPA objects in our “demo” Kubernetes environment, initially following the VPA example, and then making our own VPA tests. We used a simple `stress-ng` container to easily trigger CPU and memory utilization below and above VPA’s recommendation values, in order to verify the behavior of both the Recommender and the Updater in “Auto” mode.
Starting to feel satisfied with those results, we deployed the Vertical Pod Autoscaler in our production cluster, and created a few objects, setting the Update Mode to “Off”. We then created a Grafana dashboard to help us quickly visualize what is happening behind the scenes.
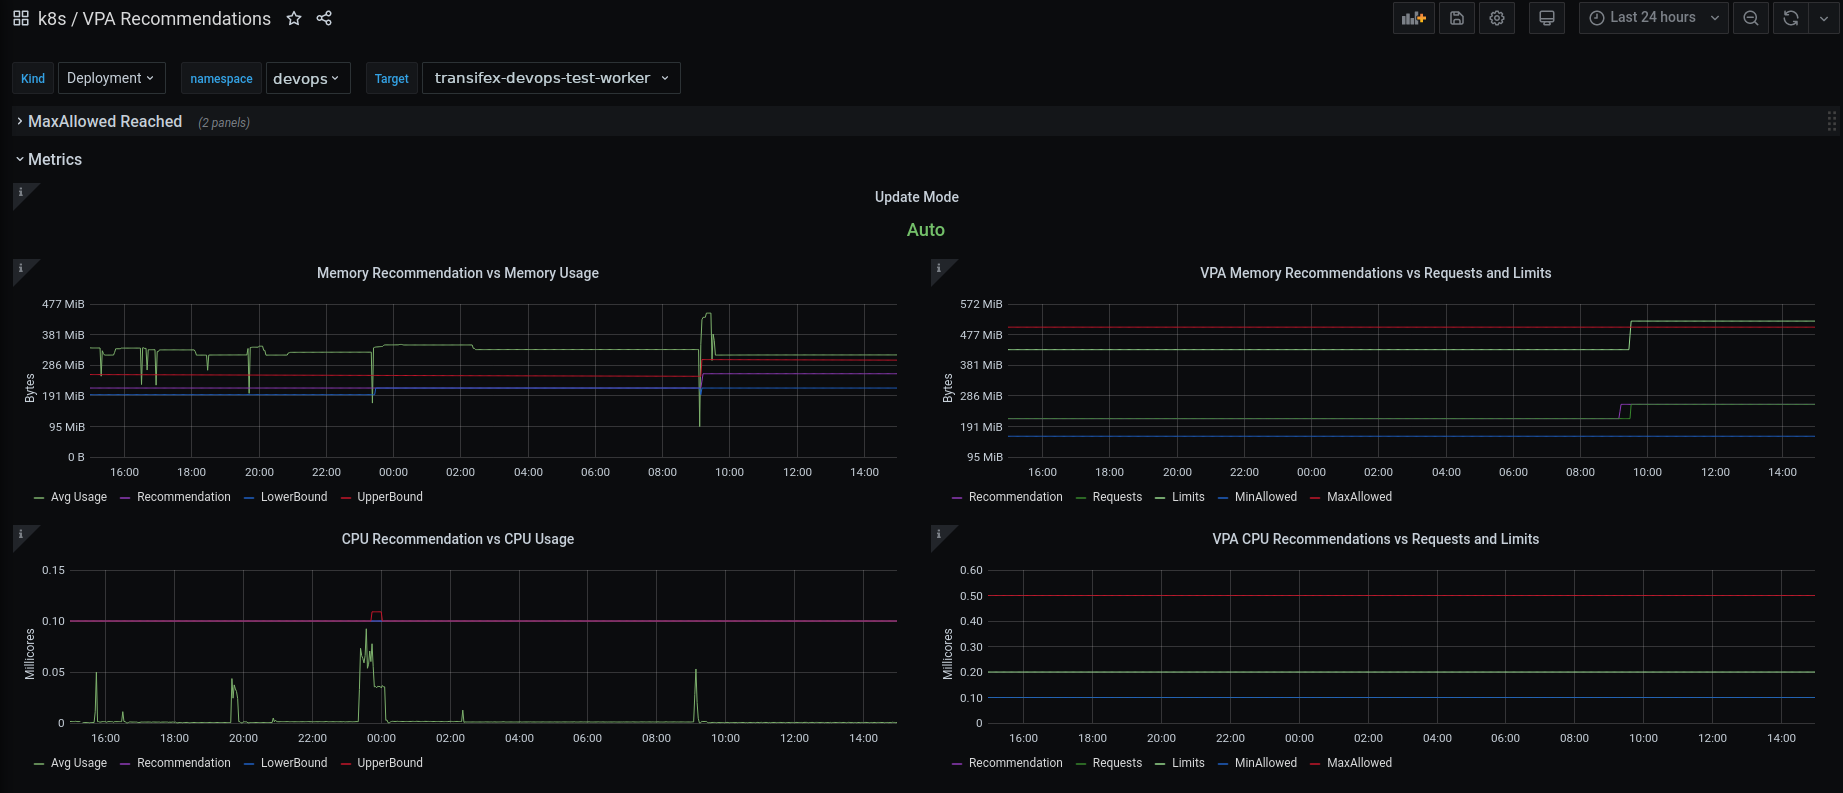
Also, since we have an EFK stack deployed, we also added a few more panels, grabbing VPA components’ logs from Elasticsearch concerning evictions, so that we can know with certainty when an eviction happens.
Example query: `kubernetes.pod_name:”vpa-updater” AND (log:”evicting” OR log:”evicted”) AND (log:”$targetName” AND log:”$namespace”)
Finally, after spending a few days with the above setup and shyly experimenting with “Auto” mode, we decided to go all-in. We started creating VPA objects for our applications’ workers in small batches, spending a couple of days monitoring them, and then moving on to a new batch of workers.
The results have been very encouraging so far!
Being able to automatically scale our infrastructure and applications, based on the incoming workload is amazing. The actual work that is required to implement autoscaling worker groups, Horizontal Pod Autoscaling and Vertical Pod Autoscaling may be challenging, but definitely do-able by a small team like ours. And although VPA is not at version 1.0 yet, it is working great in most cases.
Afterwards, the work required to keep everything up-to-date is minimal and definitely preferable to having to manually adjust every tiny cluster detail, from number and type of nodes, to container resources and number of replicas.
We will keep working on our infrastructure, its scalability and performance, while also handling all the best tools to our developers, so that everyone can create a performant application, without having to worry about cluster capacity and infrastructure bottlenecks.